NGINX日志采集架构
基础架构

完整架构

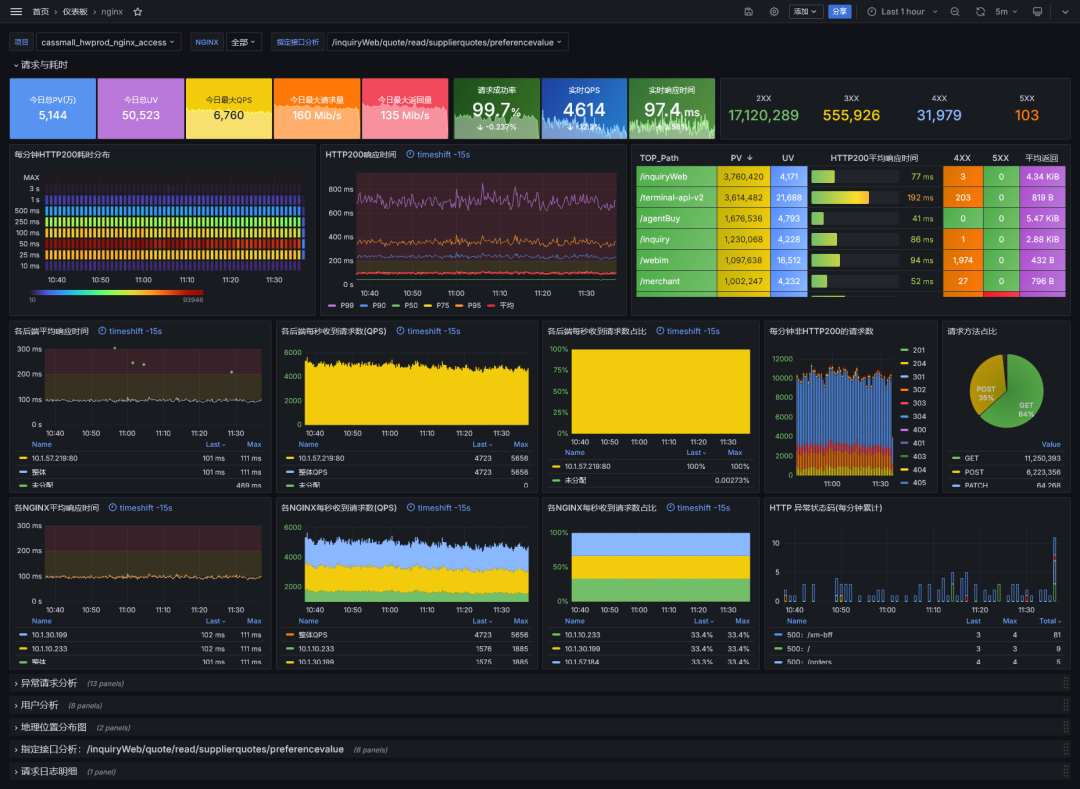
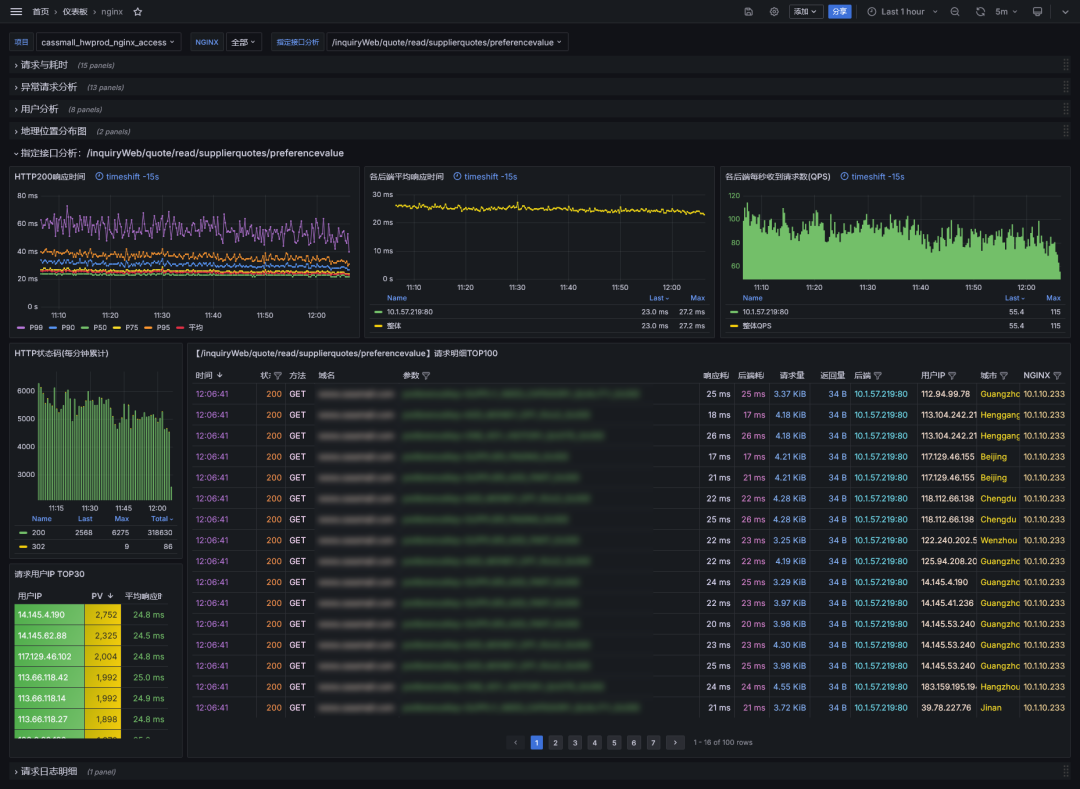
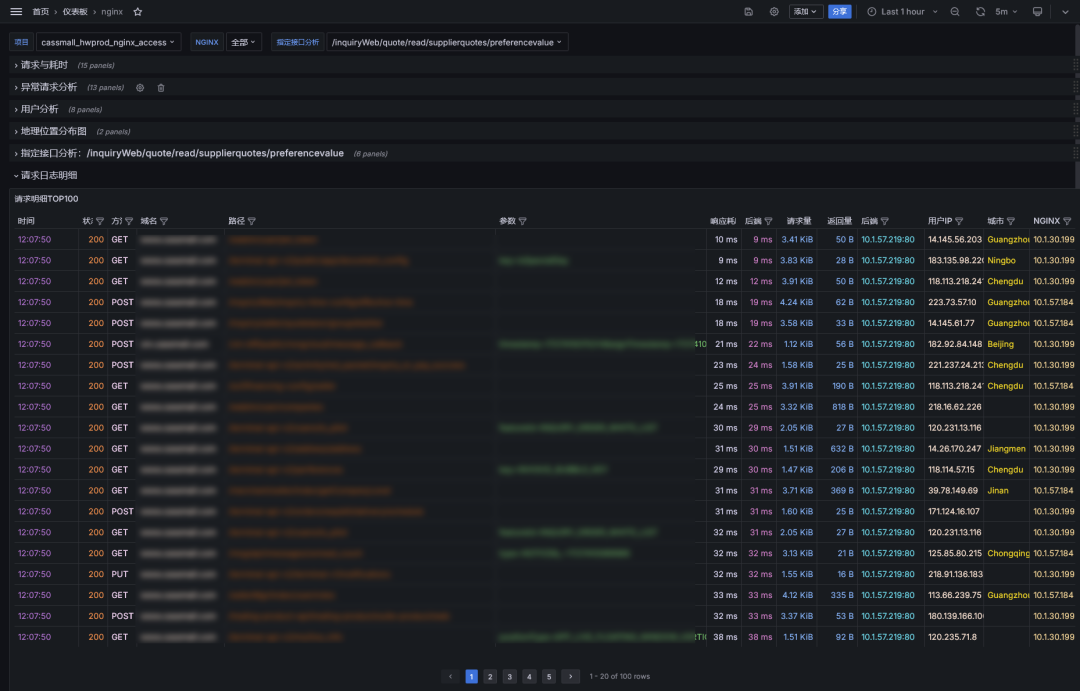
该看板是基于 ClickHouse + Vector 的NGINX请求日志分析看板。包括请求与耗时分析、异常请求分析、用户分析、地理位置分布图、指定接口分析、请求日志明细。
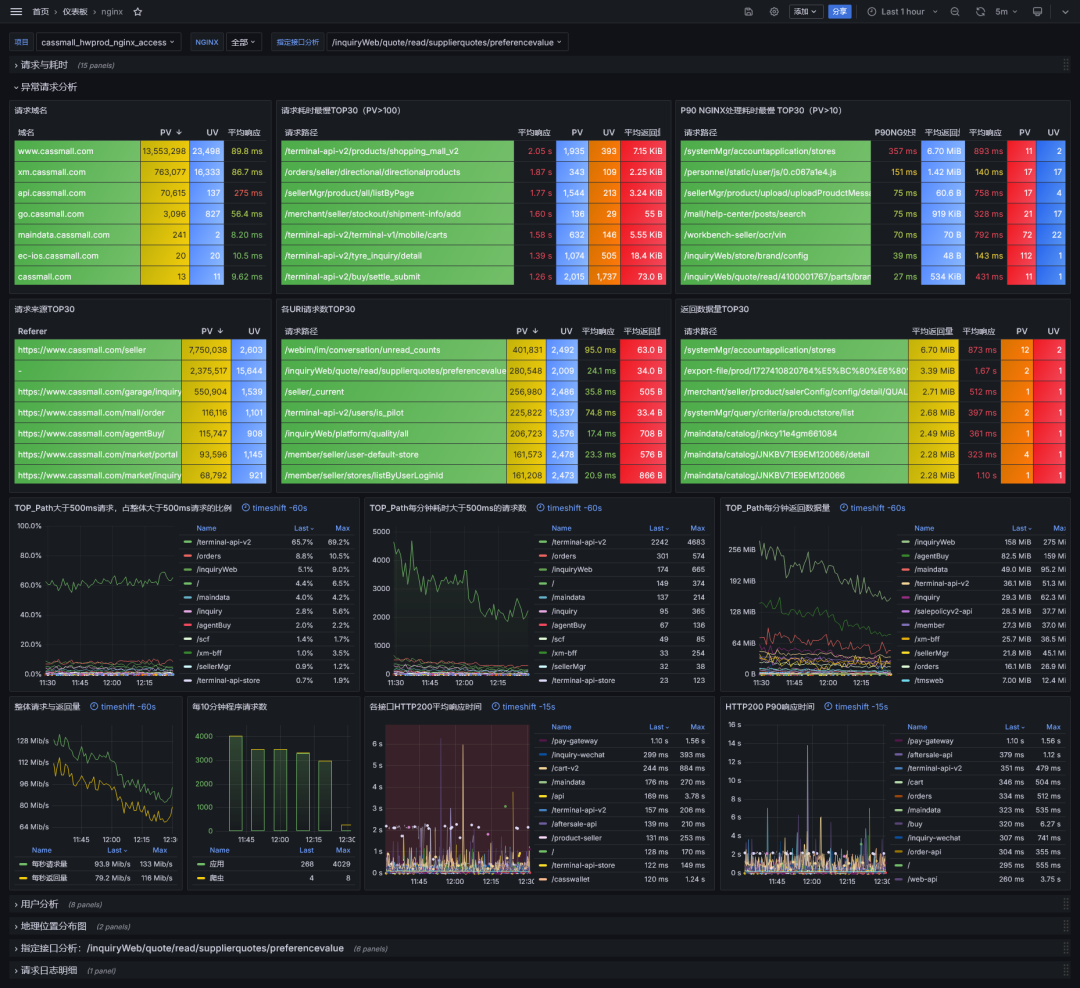
尤其在异常请求分析方面,总结多年异常请求分析经验,从各个角度设计大量异常请求的分析图表。
整体请求与耗时分析
NGINX异常请求分析
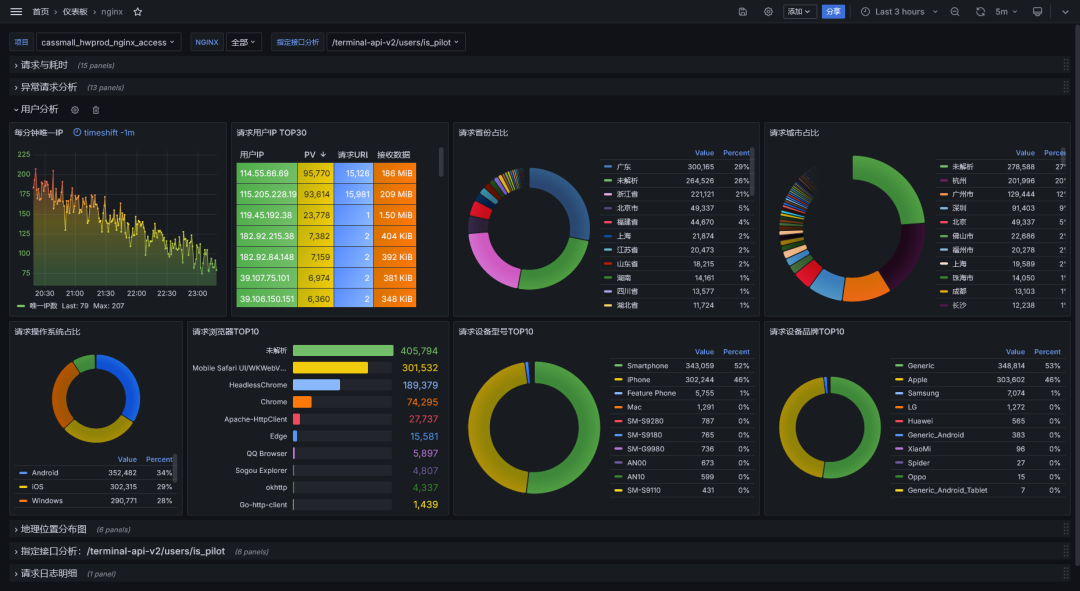
用户请求数据分析
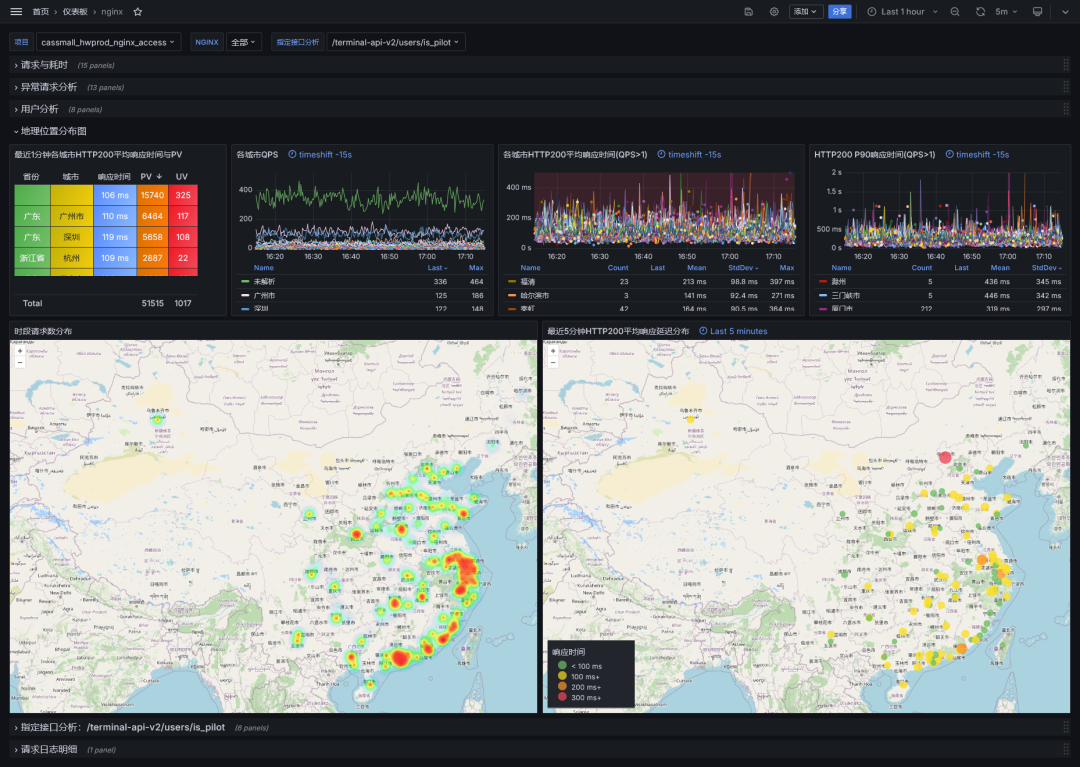
地理位置数据分析
指定接口明细分析
请求日志详情分析
修改NGINX日志格式
    map "$time_iso8601 # $msec" $time_iso8601_ms { "~(^[^+]+)(\+[0-9:]+) # \d+\.(\d+)$" $1.$3$2; }
    log_format main
        '{"timestamp":"$time_iso8601_ms",'
        '"server_ip":"$server_addr",'
        '"remote_ip":"$remote_addr",'
        '"xff":"$http_x_forwarded_for",'
        '"remote_user":"$remote_user",'
        '"domain":"$host",'
        '"url":"$request_uri",'
        '"referer":"$http_referer",'
        '"upstreamtime":"$upstream_response_time",'
        '"responsetime":"$request_time",'
        '"request_method":"$request_method",'
        '"status":"$status",'
        '"response_length":"$bytes_sent",'
        '"request_length":"$request_length",'
        '"protocol":"$server_protocol",'
        '"upstreamhost":"$upstream_addr",'
        '"http_user_agent":"$http_user_agent"'
        '}';
部署clickhouse
services:
  clickhouse:
    image: clickhouse/clickhouse-server:25.8
    hostname: clickhouse
    environment:
      TZ: Asia/Shanghai
      CLICKHOUSE_USER: default
      CLICKHOUSE_PASSWORD: password123
      CLICKHOUSE_DEFAULT_ACCESS_MANAGEMENT: 1
    volumes:
      - /opt/data/VCGdashboard/clickhouse/logs:/var/log/clickhouse-server
      - /opt/data/VCGdashboard/clickhouse/data:/var/lib/clickhouse
      - /opt/data/VCGdashboard/clickhouse/etc/clickhouse-server/config.d/config.xml:/etc/clickhouse-server/config.d/config.xml
    # - /opt/data/VCGdashboard/clickhouse/etc/clickhouse-server/users.d/users.xml:/etc/clickhouse-server/users.d/users.xml
      - /opt/data/VCGdashboard/clickhouse/docker-entrypoint-initdb.d:/docker-entrypoint-initdb.d
      - /usr/share/zoneinfo/PRC:/etc/localtime
    ports:
      - 8123:8123
    #  - 9000:9000

  grafana:
    image: grafana/grafana:11.5
    ports:
      - "3000:3000"
    environment:
      - TZ=Asia/Shanghai
      # 默认账号密码
      - GF_SECURITY_ADMIN_USER=admin
      - GF_SECURITY_ADMIN_PASSWORD=secret123
      # 匿名访问 + iframe 支持
      - GF_SECURITY_ALLOW_EMBEDDING=true
      - GF_AUTH_ANONYMOUS_ENABLED=true
      - GF_AUTH_ANONYMOUS_ORG_ROLE=Viewer
      - GF_AUTH_DISABLE_LOGIN_FORM=false
      # 域名相关配置
      - GF_SERVER_DOMAIN=192.168.100.23
      - GF_SERVER_ROOT_URL=http://192.168.100.23:3000
    volumes:
      - ./grafana/data/:/var/lib/grafana
config.d/config.xml
<clickhouse replace="true">
    <logger>
        <level>debug</level>
        <log>/var/log/clickhouse-server/clickhouse-server.log</log>
        <errorlog>/var/log/clickhouse-server/clickhouse-server.err.log</errorlog>
        <size>1000M</size>
        <count>3</count>
    </logger>
    <display_name>ch_accesslog</display_name>
    <listen_host>0.0.0.0</listen_host>
    <http_port>8123</http_port>
    <tcp_port>9000</tcp_port>
    <user_directories>
        <users_xml>
            <path>users.xml</path>
        </users_xml>
        <local_directory>
            <path>/var/lib/clickhouse/access/</path>
        </local_directory>
    </user_directories>
</clickhouse>
users.d/users.xml
生成密码(返回的第一行是明文,第二行是密文)
[root@iZwz9j7dbsko7t0h3sgas0Z ~]# PASSWORD=$(base64 < /dev/urandom | head -c8); echo "$PASSWORD"; echo -n "$PASSWORD" | sha256sum | tr -d '-'
pgzAwHdY
6715aae5fd877ae0d0762060843966b04b036ac17ed4a240c58410cb309bf35e
<?xml version="1.0"?>
<clickhouse replace="true">
<profiles>
<default>
<max_memory_usage>10000000000</max_memory_usage>
<use_uncompressed_cache>0</use_uncompressed_cache>
<load_balancing>in_order</load_balancing>
<log_queries>1</log_queries>
</default>
</profiles>
<users>
<default>
<password remove='1' />
<password_sha256_hex>6715aae5fd877ae0d0762060843966b04b036ac17ed4a240c58410cb309bf35e</password_sha256_hex>
<access_management>1</access_management>
<profile>default</profile>
<networks>
<ip>::/0</ip>
</networks>
<quota>default</quota>
<access_management>1</access_management>
<named_collection_control>1</named_collection_control>
<show_named_collections>1</show_named_collections>
<show_named_collections_secrets>1</show_named_collections_secrets>
</default>
</users>
<quotas>
<default>
<interval>
<duration>3600</duration>
<queries>0</queries>
<errors>0</errors>
<result_rows>0</result_rows>
<read_rows>0</read_rows>
<execution_time>0</execution_time>
</interval>
</default>
</quotas>
</clickhouse>docker-entrypoint-initdb.d/init.sql
CREATE DATABASE IF NOT EXISTS nginxlogs ENGINE=Atomic;
CREATE TABLE nginxlogs.nginx_access
(
    `timestamp` DateTime64(3, 'Asia/Shanghai'),
    `server_ip` String,
    `domain` String,
    `request_method` String,
    `status` Int32,
    `top_path` String,
    `path` String,
    `query` String,
    `protocol` String,
    `referer` String,
    `upstreamhost` String,
    `responsetime` Float32,
    `upstreamtime` Float32,
    `duration` Float32,
    `request_length` Int32,
    `response_length` Int32,
    `client_ip` String,
    `client_latitude` Float32,
    `client_longitude` Float32,
    `remote_user` String,
    `remote_ip` String,
    `xff` String,
    `client_city` String,
    `client_region` String,
    `client_country` String,
    `http_user_agent` String,
    `client_browser_family` String,
    `client_browser_major` String,
    `client_os_family` String,
    `client_os_major` String,
    `client_device_brand` String,
    `client_device_model` String,
    `createdtime` DateTime64(3, 'Asia/Shanghai')
)
ENGINE = MergeTree
PARTITION BY toYYYYMMDD(timestamp)
PRIMARY KEY (timestamp,
 server_ip,
 status,
 top_path,
 domain,
 upstreamhost,
 client_ip,
 remote_user,
 request_method,
 protocol,
 responsetime,
 upstreamtime,
 duration,
 request_length,
 response_length,
 path,
 referer,
 client_city,
 client_region,
 client_country,
 client_browser_family,
 client_browser_major,
 client_os_family,
 client_os_major,
 client_device_brand,
 client_device_model
)
TTL toDateTime(timestamp) + toIntervalDay(30)
SETTINGS index_granularity = 8192;
部署Vector采集日志
  vector:
    image: registry.cn-shenzhen.aliyuncs.com/starsl/vector:0.41.1-alpine
    container_name: vector
    hostname: vector
    restart: always
    entrypoint: vector --config-dir /etc/vector/conf
    ports:
      - 8686:8686
    volumes:
      - /var/log/nginx:/nginx_logs  # 这是需要采集的日志的路径需要挂载到容器内
      - ./vector/access_vector_error.log:/tmp/access_vector_error.log
      - ./vector/GeoLite2-City.mmdb:/etc/vector/GeoLite2-City.mmdb
      - ./vector/conf:/etc/vector/conf
      - /usr/share/zoneinfo/PRC:/etc/localtime
      - ./vector/data:/opt/vector/data
conf/nginx-access.yaml
# 文件直接接入vector的源配置
sources:
  01_file_nginx_access:
    type: file
    include:
      - /nginx_logs/access.log  #nginx请求日志路径(注意是挂载到容器内的路径)

# 文件-->filebeat-->kafka-->vector的源配置
#sources:
#  01kafka_nginx_access:
#    type: "kafka"
#    bootstrap_servers: "kafka1:9092,kafka2:9092,kafka3:9092"
#    group_id: "prod_nginx"
#    topics: [ "prod_nginx_logs" ]
#    commit_interval_ms: 1000

transforms:
  02_parse_nginx_access:
    drop_on_error: true
    reroute_dropped: true
    type: remap
    inputs:
      - 01_file_nginx_access
    source: |
      . = parse_json!(replace(.message, r'([^\x00-\x7F])', "\\\\$$1") ?? .message)
      if exists(.message) {
        . = parse_json!(replace(.message, "\\x", "\\\\x") ?? .message)
      }
      .createdtime = to_unix_timestamp(now(), unit: "milliseconds")
      .timestamp = to_unix_timestamp(parse_timestamp!(.timestamp , format: "%+"), unit: "milliseconds")
      .url_list = split!(.url, "?", 2)
      .path = .url_list[0]
      .query = .url_list[1]
      .path_list = split!(.path, "/", 3)
      if length(.path_list) > 2 {.top_path = join!(["/", .path_list[1]])} else {.top_path = "/"}
      .upstreamtime = to_float(.upstreamtime) ?? 0
      .duration = round((to_float(.responsetime) ?? 0) - to_float(.upstreamtime),3)
      if .xff == "-" { .xff = .remote_ip }
      .client_ip = split!(.xff, ",", 2)[0]
      .ua = parse_user_agent!(.http_user_agent , mode: "enriched")
      .client_browser_family = .ua.browser.family
      .client_browser_major = .ua.browser.major
      .client_os_family = .ua.os.family
      .client_os_major = .ua.os.major
      .client_device_brand = .ua.device.brand
      .client_device_model = .ua.device.model
      .geoip = get_enrichment_table_record("geoip_table", {"ip": .client_ip}) ?? {"city_name":"unknown","region_name":"unknown","country_name":"unknown"}
      .client_city = .geoip.city_name
      .client_region = .geoip.region_name
      .client_country = .geoip.country_name
      .client_latitude = .geoip.latitude
      .client_longitude = .geoip.longitude
      del(.path_list)
      del(.url_list)
      del(.ua)
      del(.geoip)
      del(.url)
sinks:
  03_ck_nginx_access:
    type: clickhouse
    inputs:
      - 02_parse_nginx_access
    endpoint: http://192.168.100.23:8123  #clickhouse http接口
    database: nginxlogs  #clickhouse 库
    table: nginx_access  #clickhouse 表
    auth:
      strategy: basic
      user: default  #clickhouse 用户名
      password: pgzAwHdY  #clickhouse 密码
    compression: gzip
  04_out_nginx_dropped:
    type: file
    inputs:
      - 02_parse_nginx_access.dropped
    path: /tmp/access_vector_error.log  #解析异常的日志
    encoding:
      codec: json
enrichment_tables:
  geoip_table:
    path: "/etc/vector/GeoLite2-City.mmdb"
    type: geoip
    locale: "zh-CN" #获取到的地域信息使用中文显示,删掉这行默认是英文显示,能解析数据量会比中文多一点点
conf/vector.yaml
# 默认文件存储目录,Vector需要一些磁盘空间来持久化当前运行状态
# 例如用来当作磁盘缓冲区,或者保存checkpoints
data_dir: "/opt/vector/data"
timezone: "Asia/Shanghai"
api:
  enabled: true
  address: "0.0.0.0:8686"
使用grafana看板
  grafana:
    image: grafana/grafana:11.5
    ports:
      - "3000:3000"
    environment:
      - TZ=Asia/Shanghai
      # 默认账号密码
      - GF_SECURITY_ADMIN_USER=admin
      - GF_SECURITY_ADMIN_PASSWORD=secret123
      # 匿名访问 + iframe 支持
      - GF_SECURITY_ALLOW_EMBEDDING=true
      - GF_AUTH_ANONYMOUS_ENABLED=true
      - GF_AUTH_ANONYMOUS_ORG_ROLE=Viewer
      - GF_AUTH_DISABLE_LOGIN_FORM=false
      # 域名相关配置
      - GF_SERVER_DOMAIN=192.168.100.23
      - GF_SERVER_ROOT_URL=http://192.168.100.23:3000
    volumes:
      - ./grafana/data/:/var/lib/grafana
Grafana新增ClickHouse数据源
在Grafana中增加ClickHouse数据源时,注意点开Additional settings右边的箭头,配置Default database为存放日志的默认库,如上的:nginxlogs
导入NGINX请求日志分析的Grafana看板
Grafana看板ID:22037
下载地址:
https://grafana.com/grafana/dashboards/22037
注意:如果你保存日志的表名不是access结尾的,项目菜单会没有数据,需要点击看板右上角的设置-变量-project,在下方的Regex项,输入你需要展示的日志表的正则,或者留空,展示默认库的所有表。
基于CH的NGINX请求日志异常告警
每分钟检查一次,对最近一分钟内NGINX的请求做聚合分析统计,触发以下情况则立刻发送告警通知:
最近一分钟,同一接口异常请求大于指定次数。
最近一分钟整体响应延迟大于指定时间。
告警实现了对异常接口的分析:异常请求数、耗时、占比、状态码、来源、目标等信息。
基于alertmanager,实现对不需要告警接口的屏蔽功能,支持设置屏蔽时长。
支持设置开启告警通知的时间段。
支持企微、钉钉、飞书告警,并@指定人员。
#!/usr/bin/python3
import time, requests, json
from clickhouse_driver import Client
from datetime import datetime, timedelta

# ClickHouse数据库连接信息
CK_HOST = "10.7.0.226"
CK_PORT = 9000  # ClickHouse TCP端口
CK_USER = "default"
CK_PASSWORD = ""
CK_DATABASE = "nginxlogs"  # ClickHouse nginx请求日志所在的数据库
tables = ["cassmall_hwprod_nginx_access", "smart_hwprod_nginx_access"]  # 存放access日志的表

# Alertmanager和告警相关配置
alertmanager_url = "http://10.0.0.26:9095"  # Alertmanager地址
alarm_threshold = 10  # 5xx异常次数阈值
rt_threshold = 100  # RT延迟告警阀值(毫秒)
check_interval = 1  # 检查时间间隔(分钟)
group_token = 'fd10a-98811'  # 群机器人token

## 企微应用推送的信息
corp_id = "wx34xxxxxx"  # 企微的公司corp_id
secret = "4kUHzGZghjltrWTpac"  # 企微应用的secret
agent_id = "1000011"  # 企微应用的agent_id
headers = {"content-type": "application/json"}
touser = "a1234|a6789"  # 企微的用户ID,支持同时推送多个用户,输入多个用户ID,并使用 | 分隔。

# 获取当前时间和检查时间段
now = datetime.now()
thism = now.strftime("%Y-%m-%d %H:%M")
beforem = (now - timedelta(minutes=check_interval)).strftime("%Y-%m-%d %H:%M")
tsthism = datetime.strptime(f"{thism}:00", "%Y-%m-%d %H:%M:%S").timestamp()
tsbeforem = datetime.strptime(f"{beforem}:00", "%Y-%m-%d %H:%M:%S").timestamp()
print(beforem, thism)

# 延迟告警的时间范围
timestart = datetime.strptime(str(now.date()) + '09:00', '%Y-%m-%d%H:%M')  # 开始时间
timeend = datetime.strptime(str(now.date()) + '18:00', '%Y-%m-%d%H:%M')  # 结束时间


# 获取企微token
def wb_token(current_timestamp):
    token_url = f"https://qyapi.weixin.qq.com/cgi-bin/gettoken?corpid={corp_id}&corpsecret={secret}"
    response = requests.request("GET", token_url)
    token = response.json()['access_token']
    with open('token.pickle', 'wb') as file:
        pickle.dump([current_timestamp, token], file)
    return token

# 检查企微token
def get_token():
    current_timestamp = datetime.datetime.now().timestamp()
    if os.path.exists('token.pickle'):
        with open('token.pickle', 'rb') as file:
            token_list = pickle.load(file)
            if current_timestamp - token_list[0] > 7000:
                print('获取新token')
                return wb_token(current_timestamp)
            else:
                print('使用旧token')
                return token_list[1]
    else:
        print('获取新token')
        return wb_token(current_timestamp)


def wecom_app(md, touser):
    token = get_token()
    url = f"https://qyapi.weixin.qq.com/cgi-bin/message/send?access_token={token}"
    body = {
        "touser": touser,
        "msgtype": "markdown",
        "agentid": agent_id,
        "markdown": {"content": md},
    }
    r = requests.post(url=url, json=body, headers=headers)
    print(r.json())


def wecom_group(md, token, at=''):
    '''
    发送消息到企业微信
    at格式:
    - "@+企微ID":@具体人;支持@多个人,写法:@abc@def
    - "":不@人
    '''
    total_len = len(md.encode('utf-8'))
    if total_len > 4000:
        md = md[0:2000]  # 消息长度限制
    at = '<@' + '><@'.join(at.split('@')[1:]) + '>' if at else ''

    webhook = f'https://qyapi.weixin.qq.com/cgi-bin/webhook/send?key={token}'
    headers = {'Content-Type': 'application/json'}
    params = {'msgtype': 'markdown', 'markdown': {'content': f"{md}\n{at}"}}
    data = bytes(json.dumps(params), 'utf-8')
    response = requests.post(webhook, headers=headers, data=data)
    print(f'【wecom】{response.json()}')


def dingding(md,token):
    webhook = f'https://oapi.dingtalk.com/robot/send?access_token={token}'
    headers = {'Content-Type': 'application/json'}
    params = {"msgtype":"markdown","markdown":{"title":"告警通知","text":md},"at":{"isAtAll":True}}
    data = bytes(json.dumps(params), 'utf-8')
    response = requests.post(webhook, headers=headers, data=data)
    print(f'【dingding】{response.json()}')

def feishu(md,token):
    title = "告警通知"
    webhook = f'https://open.feishu.cn/open-apis/bot/v2/hook/{token}'
    headers = {'Content-Type': 'application/json'}
    params = {"msg_type": "interactive",
              "card": {"header": {"title": {"tag": "plain_text","content": title},"template": "red"},
                       "elements": [{"tag": "markdown","content": f"{md}\n<at id=all></at>",}]}}
    data = json.dumps(params)
    response = requests.post(webhook, headers=headers, data=data)
    print(f'【feishu】{response.json()}')


def is_silence(path):
    # 检查Alertmanager中是否有活跃的静默
    url = f"{alertmanager_url}/api/v2/silences?filter=type=%225xx%22&filter=path=%22{path}%22&active=true"
    silence_list = requests.get(url).json()
    sid_list = [i["id"] for i in silence_list if i["status"]["state"] == "active"]
    if sid_list:
        return True
    else:
        return False


# 连接ClickHouse数据库
ckclient = Client(host=CK_HOST, port=CK_PORT, user=CK_USER, password=CK_PASSWORD, database=CK_DATABASE)

for table in tables:
    # 查询5xx错误的请求
    query = f"""
        SELECT concat(domain,':',path) as path, responsetime, status, upstreamhost, server_ip, client_ip
        FROM {table}
        PREWHERE (timestamp >= '{beforem}:00' AND timestamp < '{thism}:00') AND (status > 499)
    """

    # 查询HTTP 200请求的平均响应时间
    rt_query = f"""
        SELECT avg(responsetime)
        FROM {table}
        PREWHERE (timestamp >= '{beforem}:00' AND timestamp < '{thism}:00') and (status=200)
    """

    result, _ = ckclient.execute(query, with_column_types=True)
    columns = [x[0] for x in _]
    rows = [dict(zip(columns, row)) for row in result]
    alert_url_dict = {}
    rowsnum = len(rows)
    print(f"{table}:5xx异常共计:", rowsnum)

    # 计算最近一分钟的HTTP 200平均响应时间
    try:
        rt = int(1000 * ckclient.execute(rt_query, with_column_types=False)[0][0])
    except:
        rt = 0
    print(f"{table}:最近1分钟HTTP200平均响应时间:", rt)
    if rt > rt_threshold and (now >= timestart and now <= timeend):
        rtmd = (
            f'## <font color="#ff0000">【{table}】</font>\n'
            f'- 最近1分钟HTTP200平均响应时间:<font color="#ff0000">{rt}ms</font>\n'
        )
        wecom_group(rtmd, group_token)
        # wecom_app(rtmd, touser)

    if rows:
        for row in rows:
            # 统计每个路径的异常信息
            if row["path"] not in alert_url_dict:
                alert_url_dict[row["path"]] = {}
            for column, value in row.items():
                if column == "path":
                    if "total" not in alert_url_dict[row["path"]]:
                        alert_url_dict[row["path"]]["total"] = 1
                    else:
                        alert_url_dict[row["path"]]["total"] += 1
                elif column == "responsetime":
                    if "responsetime" not in alert_url_dict[row["path"]]:
                        alert_url_dict[row["path"]]["responsetime"] = value
                    else:
                        alert_url_dict[row["path"]]["responsetime"] += value
                else:
                    if column not in alert_url_dict[row["path"]]:
                        alert_url_dict[row["path"]][column] = {}
                    if value not in alert_url_dict[row["path"]][column]:
                        alert_url_dict[row["path"]][column][value] = 1
                    else:
                        alert_url_dict[row["path"]][column][value] += 1
        # print(alert_url_dict)

        for k, v in alert_url_dict.items():
            if v["total"] >= alarm_threshold:
                url = k
                # 检查是否存在静默
                if is_silence(url):
                    print('===', url, '已被忽略')
                    continue
                print(f"==={table}:", url, "开始处理")
                urlnum = v["total"]
                # 查询特定路径的请求总数
                domain, path = url.split(':',1)
                url_query = f"""
                    SELECT count()
                    FROM {table}
                    PREWHERE (timestamp >= '{beforem}:00' AND timestamp < '{thism}:00') and domain = '{domain}' and path = '{path}'
                """
                count_url = ckclient.execute(url_query, with_column_types=False)[0][0]
                pnum = round(urlnum / count_url * 100, 2)
                responsetime = int(v["responsetime"] * 1000 / urlnum)

                # 生成告警信息
                nginxinfo = ""
                topnginx = sorted(v["server_ip"].items(), key=lambda x: x[1], reverse=True)
                for nginx, num in topnginx:
                    nginxinfo += f'{nginx}<font color="#ff0000">({num})</font>;'

                statusinfo = ""
                topstatus = sorted(v["status"].items(), key=lambda x: x[1], reverse=True)
                for status, num in topstatus:
                    statusinfo += f'{status}<font color="#ff0000">({num})</font>;'

                srcinfo = ""
                lensrc = "{:02d}".format(len(v["client_ip"]))
                top3src = sorted(v["client_ip"].items(), key=lambda x: x[1], reverse=True)[:3]
                for src, num in top3src[0:3]:
                    srcinfo += f'{src}<font color="#ff0000">({num})</font>\n                     '
                srcinfo = srcinfo.strip()

                destinfo = ""
                lendest = "{:02d}".format(len(v["upstreamhost"]))
                top3dest = sorted(v["upstreamhost"].items(), key=lambda x: x[1], reverse=True)[:3]
                for dest, num in top3dest[0:3]:
                    destinfo += f'{dest}<font color="#ff0000">({num})</font>\n                     '
                destinfo = destinfo.strip()

                silence_url = f"{alertmanager_url}/#/silences/new?filter=%7Btype%3D%225xx%22%2C%20path%3D%22{url}%22%7D"

                md = (
                    f'# {table}\n'
                    f'## <font color="#ff0000">【{url}】返回5XX异常 **{urlnum}** 次(耗时:{responsetime}ms,异常占:{pnum}%)</font>\n'
                    f"- 时间:{beforem}~~{thism}\n"
                    f"- 状态:{statusinfo}\n"
                    f"- NG:{nginxinfo}\n"
                    f"- 来源[3/{lensrc}]:{srcinfo}\n"
                    f"- 目标[3/{lendest}]:{destinfo}\n"
                    f"- [【屏蔽】]({silence_url})【当前时段总5XX:{rowsnum}】\n"
                )
                print(md)
                wecom_group(md, group_token)
                # wecom_app(md, touser)
# 断开ClickHouse数据库连接
ckclient.disconnect()
运行
# crontab -e
2* * * * * /opt/monit/ch-nginx-alert.py